If you’re tired of manually building local SEO reports every month, you’re not alone. As the digital marketing world increasingly leans on automation, businesses and agencies alike are searching for faster, smarter, and more scalable solutions. That’s where combining Python and Google Data Studio (also known as Looker Studio) steps in. This powerful duo can eliminate repetitive tasks, improve data accuracy, and offer real-time insights into your local SEO performance. In this guide, we’ll walk through exactly how to automate your Local SEO reports covering tools, code, integrations, and best practices.
Local SEO reporting helps businesses track performance across search engines like Google. Whether you manage one location or multiple, visibility in local search depends on data-driven decision-making. Accurate reports can highlight fluctuations in keyword rankings, traffic sources, Bounce Rate, and Core Web Vitals all of which influence your presence in local search results. It also helps diagnose on-page SEO issues, such as duplicate content or poor meta tag structure.
Local SEO reports are essential for any business that relies on nearby customers. This includes small business owners monitoring Google My Business listings, multi-location franchises, and SEO professionals managing client portfolios. These reports ensure transparency, accountability, and the ability to pivot quickly based on trends in keyword visibility or local ranking analysis.
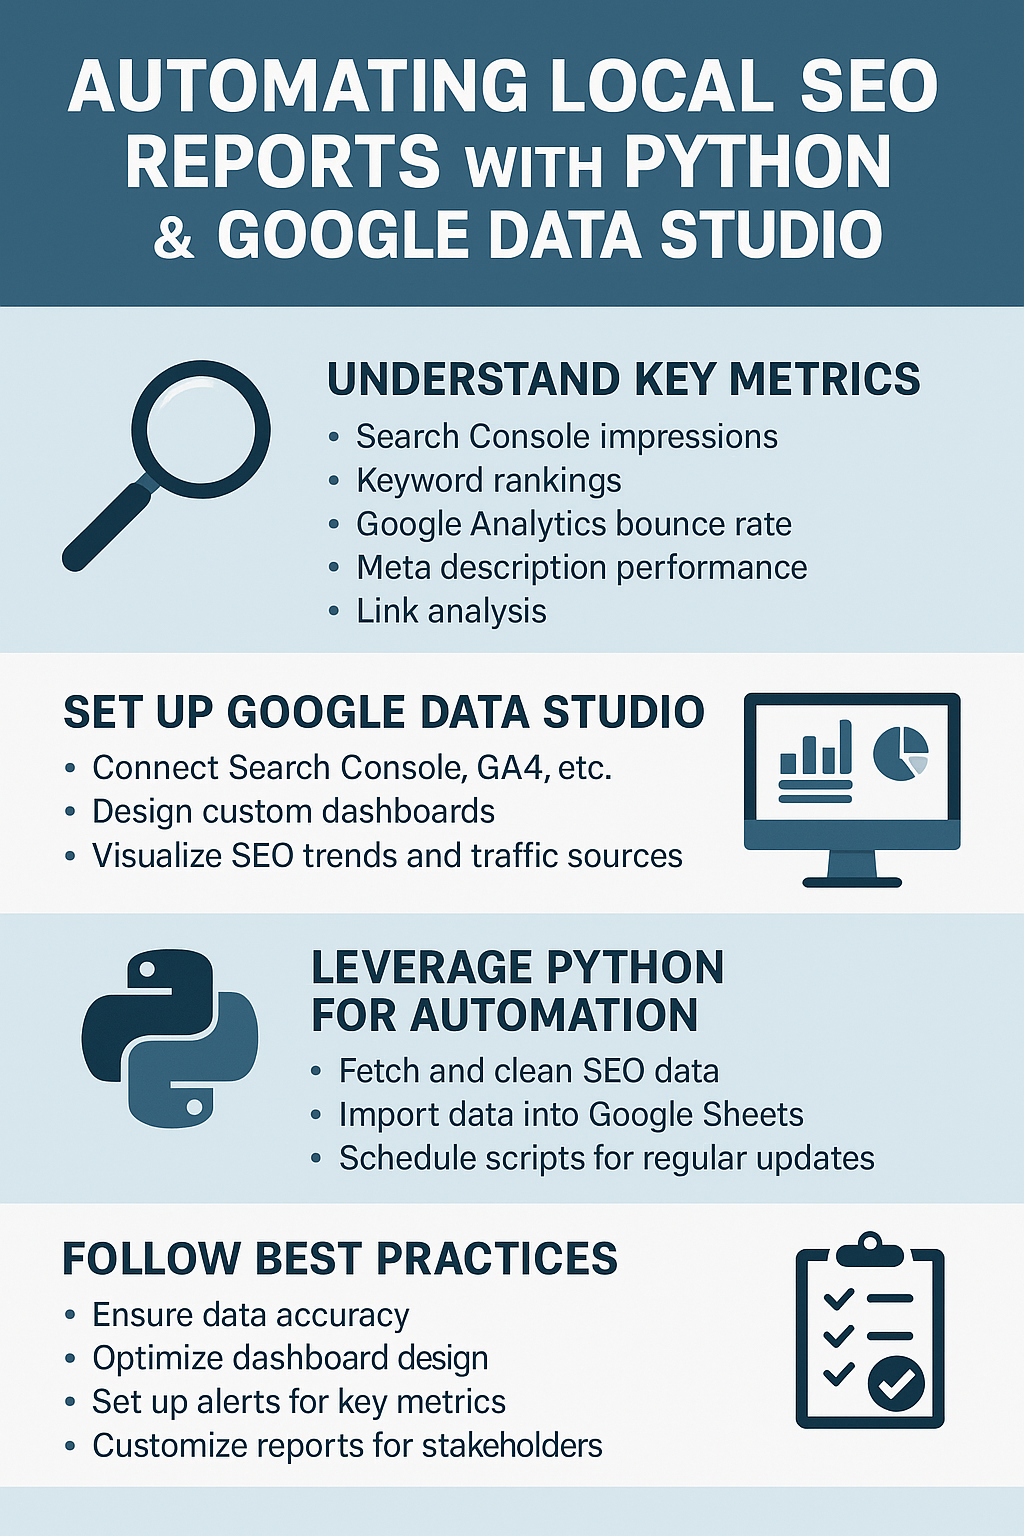
Metrics that impact Local SEO include:
By combining these KPIs, businesses can optimize both content strategies and technical SEO elements.
Google Data Studio is a free visualization tool that pulls data from multiple sources. It integrates with Google Search Console, Google Analytics 4, Google Sheets, and more. For SEO reporting, it offers the flexibility to design interactive dashboards that display keyword research trends, traffic sources, and on-page performance.
While Google Analytics dashboards are useful, they come with limitations such as the 12-widget cap that can hinder flexibility for more advanced reporting needs. This is why many SEO professionals migrate to Google Data Studio, which offers a more dynamic and customizable reporting experience.
Instead of manual copy-pasting, connect your tools:
For those looking to explore deeper integrations, Google Analytics 4 now offers compatibility with BigQuery, making large-scale data analysis much more accessible even for those just getting started.
Custom dashboards should focus on clarity and goals. Include:
Python allows SEO professionals to automate repetitive tasks. By using Python scripts, you can access and analyze large volumes of data, speeding up tasks like:
SEO automation doesn’t require deep programming knowledge. Tools like Jupyter Notebook, PyCharm CE, or VS Code make it easy to test and deploy code. Start by learning how to authenticate with the Google Sheets API, fetch data using Requests, and manipulate it using Pandas.
Once you’ve cleaned the data, it can be sent to Google Sheets, allowing your Data Studio dashboard to auto-refresh. This reduces manual SEO reporting errors and gives you more time to focus on content optimization or Link Building.
APIs like the Google Places API and Search Console API give you structured data to work with. For sites that don’t offer APIs, tools like BeautifulSoup or lxml help scrape data such as meta tags, HTML elements, or HTTP status codes.
Python’s flexibility means you can create customized automation—whether you’re tracking internal links, keyword groupings, or page speed issues.
The integration process typically includes:
This approach reduces dependency on manual workflows and ensures your SEO Report reflects the latest data.
# Sample Python code to update Google Sheet
import pandas as pd
import gspread
from oauth2client.service_account import ServiceAccountCredentials

scope = ["https://spreadsheets.google.com/feeds", "https://www.googleapis.com/auth/drive"]
creds = ServiceAccountCredentials.from_json_keyfile_name("credentials.json", scope)
client = gspread.authorize(creds)
sheet = client.open("SEO Report").sheet1

data = pd.read_csv("seo_data.csv")
sheet.update([data.columns.values.tolist()] + data.values.tolist())
Python lets you schedule tasks using cron jobs or trigger them from platforms like Zapier. For instance, a script can run weekly to pull keyword research data, calculate Bounce Rate, analyze crawl depth, and push it to Google Sheets. Google Data Studio picks up the latest updates instantly, offering real-time search engine optimization insights.
You can also use ML-Enabled SERP Analysis to track algorithm updates or experiment with Natural Language Processing to tag content topics automatically.
Accuracy is the foundation of effective SEO reporting. Start by validating every API response to confirm that you’re receiving the expected values. Missing or malformed data can distort the entire report and lead to poor decision-making. Regular testing for null values or mismatches between data types is essential.
Equally important is keeping your keyword list current. SEO trends shift quickly, so tools like Google Keyword Planner should be used routinely to refresh and expand your keyword dataset. This ensures that your reports reflect current search demand and user behavior.
You should also cross-reference automated reports with occasional manual checks. Comparing automated outputs against manual SEO reports helps catch inconsistencies early, especially when integrating multiple data sources like Search Console and Google Analytics.
A dashboard isn’t effective unless it’s understandable at a glance. Avoid cramming too many metrics into one view. Instead, group data into logical sections, like keyword visibility, Bounce Rate performance, and PageSpeed Insights, to help viewers process information easily.
Each section should be clearly labeled with readable text and color-coded indicators. Dimensions like Page Title, Meta Description, and backlinks should be identified in ways that reflect their SEO impact. You can also use anomaly detection tools or formatting rules to highlight sudden drops in traffic or issues like duplicate content or missing meta tags.
Remember, dashboards are storytelling tools. The goal is not just to present data but to drive action through clarity.
Looker Studio gives you access to advanced visualization options that go far beyond static graphs. Conditional formatting in scorecards, for example, lets you highlight red flags like a drop in CTR or poor Core Web Vitals.
You can use layered bar graphs or line charts to illustrate long-term SEO trends, showing how algorithm updates or technical optimizations have impacted keyword rankings or Bounce Rate. Interactive tables with filters allow users to drill into page-specific issues, connecting data directly to content optimization workflows.
The more visual your dashboard, the easier it becomes for stakeholders to grasp complex insights and make data-driven decisions.
Platforms like Looker Studio allow marketers to create highly customized and automated SEO dashboards, simplifying the way performance data is tracked, analyzed, and presented to different stakeholders.
One of the biggest advantages of automation is real-time alerting. Using Python scripts, you can set thresholds and receive notifications when metrics cross those limits. For example, if your CTR in Search Console drops below 2%, your script can send an email or Slack message.
You can also monitor keyword rankings and set alerts when a page falls out of the top 10 or if a sudden spike in 404 errors is detected. By tying alert systems into your Google Sheets or other data pipelines, you’re able to respond to issues before they escalate.
Alerts empower SEO professionals to act swiftly and reduce lag between data analysis and resolution.
Each audience has different priorities, so a one-size-fits-all report rarely works. For business development teams, your report should focus on revenue-driving metrics, such as traffic growth, leads, and ROI calculations.
Clients, especially small business owners, benefit from simplified dashboards that highlight their Google My Business performance, keyword visibility, and progress on local SEO goals. Use visuals to tell a clear story of growth.
Internal teams such as developers or content creators may need detailed views into crawl errors, internal linking structures, or opportunities for technical optimization. By tailoring your dashboards to the end user, you make your data more actionable and relevant.
Automating your Local SEO reports with Python and Google Data Studio is no longer optional it’s essential for staying competitive. With the right setup, your team can shift from manual SEO reporting to proactive strategy execution. From website audits to keyword rankings, everything becomes measurable, visual, and scalable.
If you’re ready to build smarter SEO systems, contact Supreme Rank SEO to develop custom dashboards and automation workflows tailored to your business.